Home -›
POS -› Reports
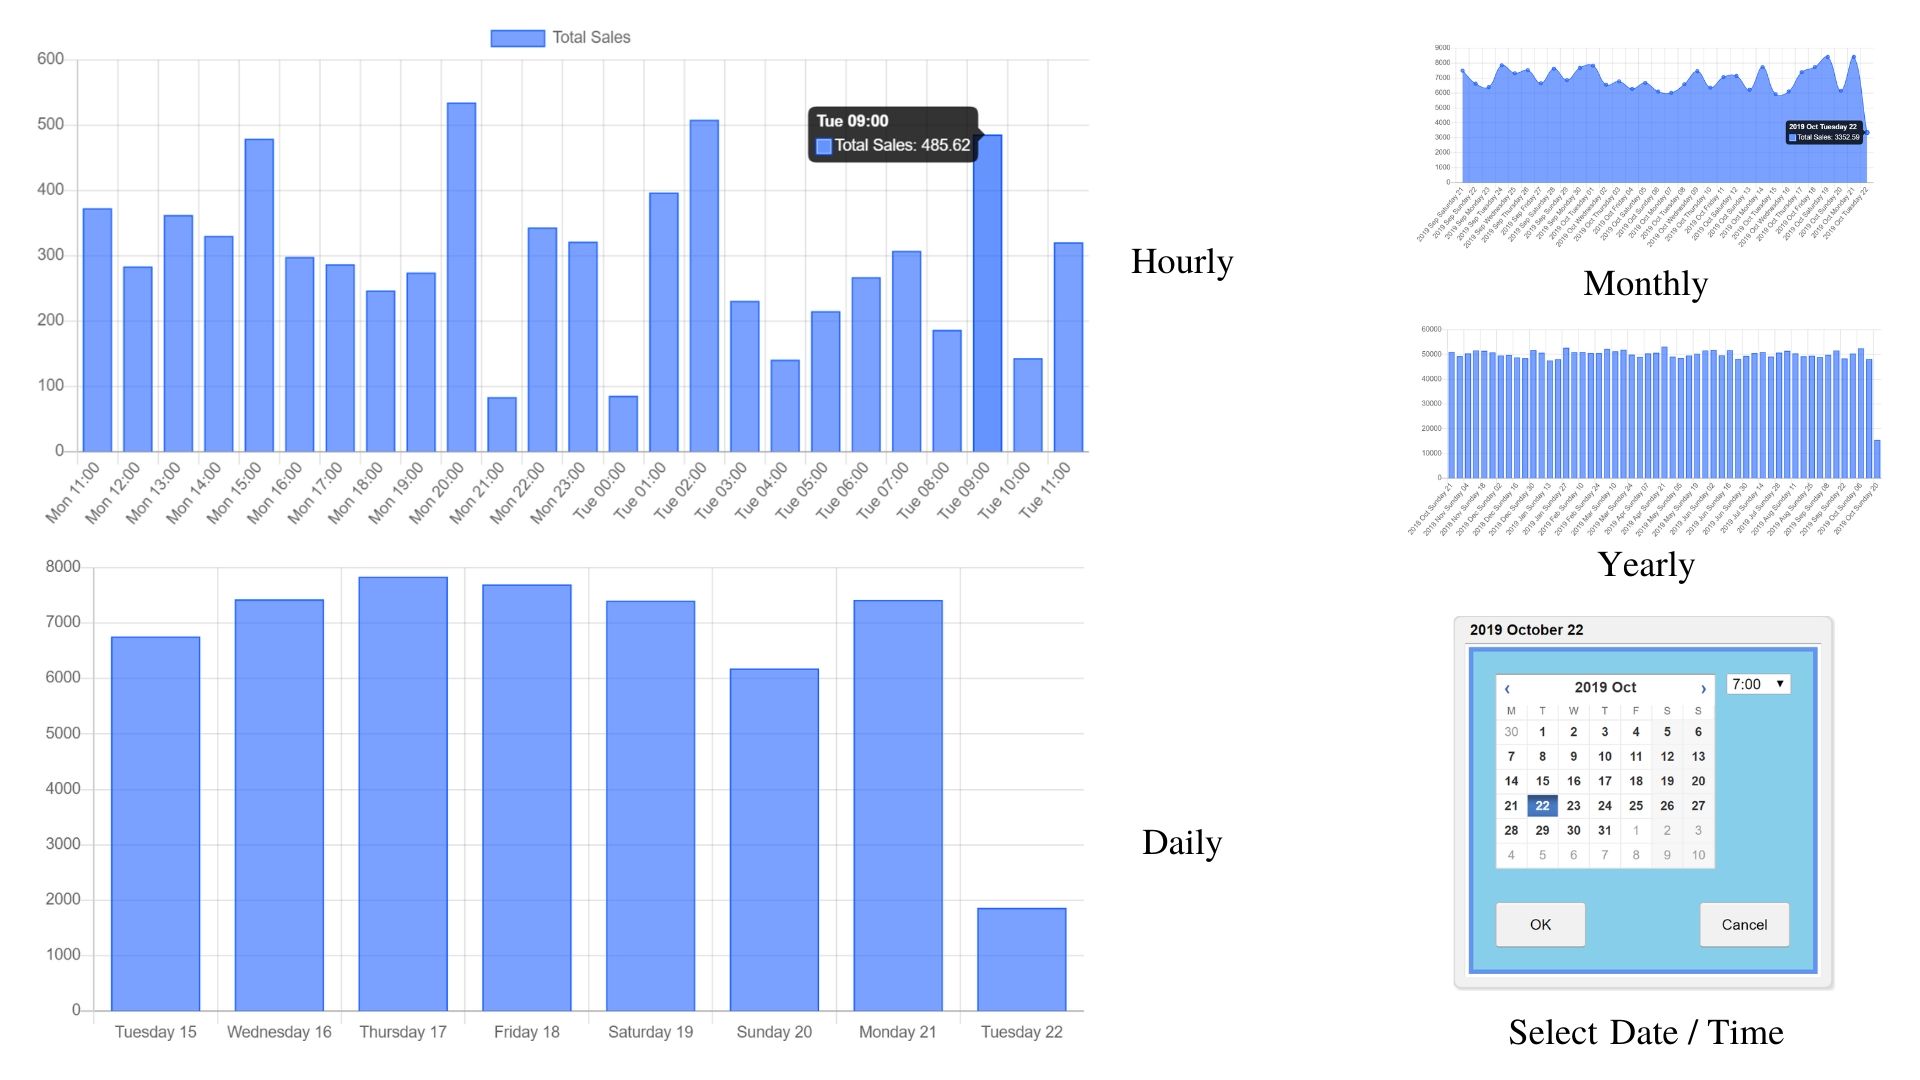
Live sales: Hourly, Daily, Weekly, Monthly and Yearly.
Go to Settings - Admin - Dashboard.
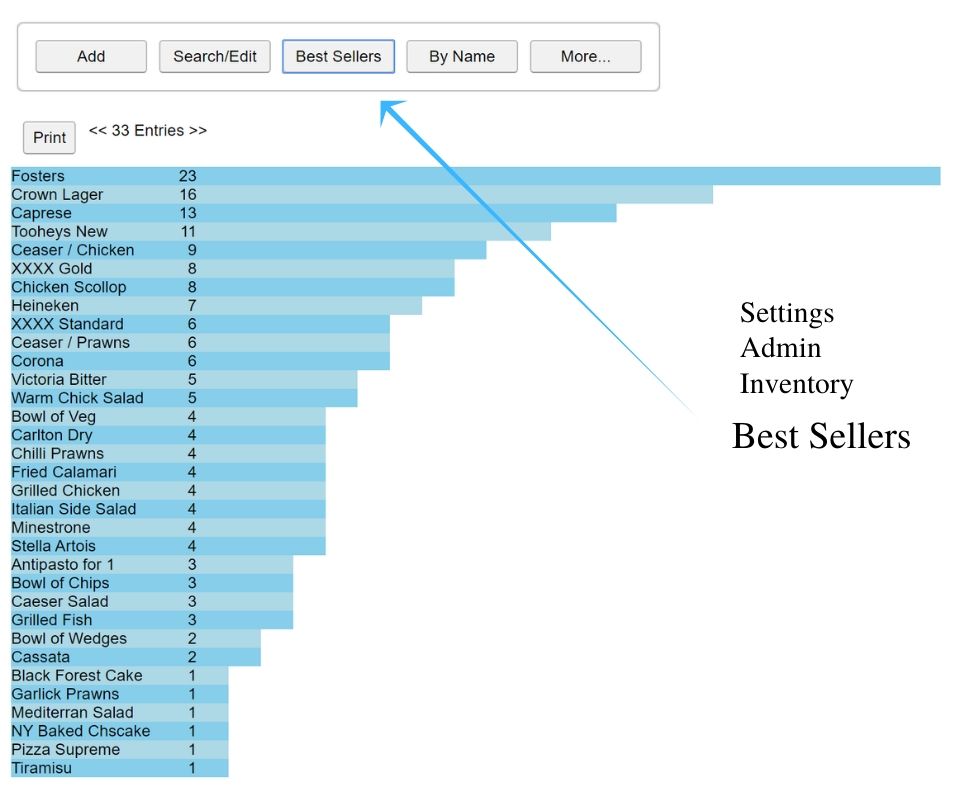
Go to Settings - Admin - Inventory - Best Sellers.
Inventory Count
Generate all sorts of charts & graphs, here are a few examples:
Dashboard
Live sales: Hourly, Daily, Weekly, Monthly and Yearly.
Go to Settings - Admin - Dashboard.
Best Sellers
Real Time Best Sellers & Inventory Count:Go to Settings - Admin - Inventory - Best Sellers.
Inventory Count
SplitAbility maintains sales data and inventory levels in real time. Data is accessible on any logged in device.
Editable levels with associated Maximum & Minimum settings plus descriptions to allow stock control.
Listings include best selling items, alphabetic and search on individual items.
Inventory count is automatic i.e. there is no need to add items to the system. All levels can be reset by the administrator and the count is user configurable to increment up or down.
SplitAbility pushes all user data back to the user's private and secure account in the form of a "transaction journal".
A daily time stamped transaction journal can be found in your Google Drive in the folder "SplitAbility".
The transaction journal contains the complete history of all orders, staff log in/out times, inventory and balancing data (x & z reads).
From the transaction journal you may customise your own reporting and analytics to match your business needs, create pivot table reports and see your businesses operation in high quality graphs and charts.
For more on business insights see profitability.
For information on end of day/shift close off see balancing.
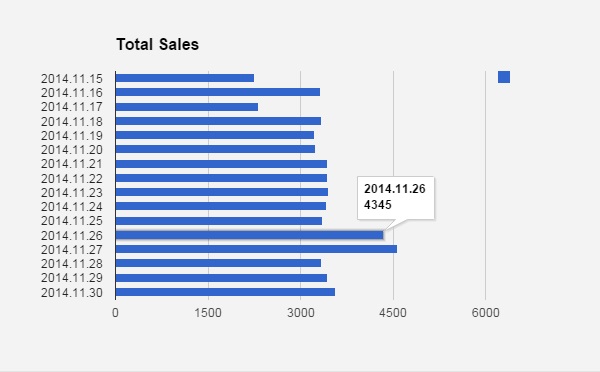
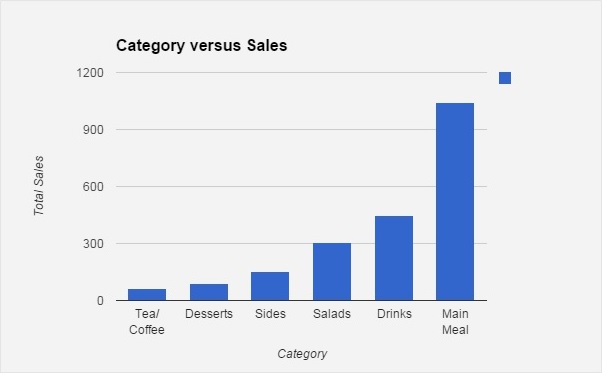
Generate all sorts of charts & graphs, here are a few examples:
 |
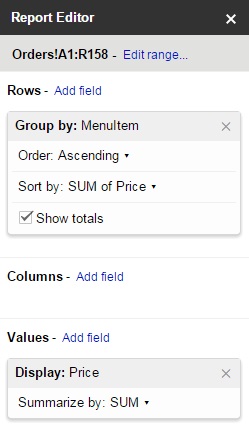
| How to generate |
| Total Sales vs Date |
 |
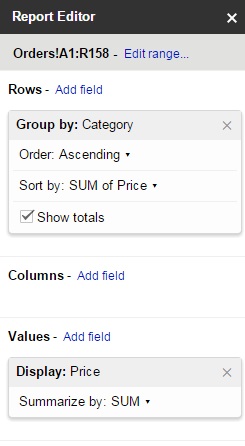
| Report Editor Settings |
| Category / Sales |
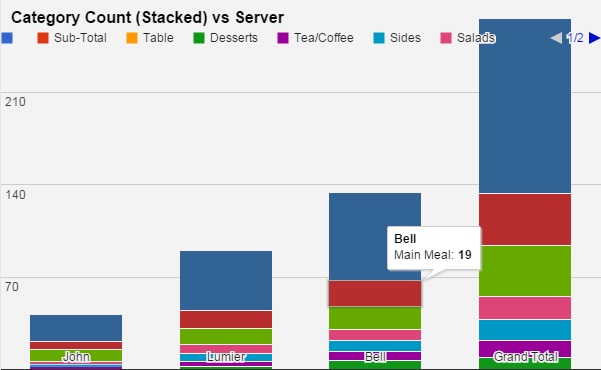 |
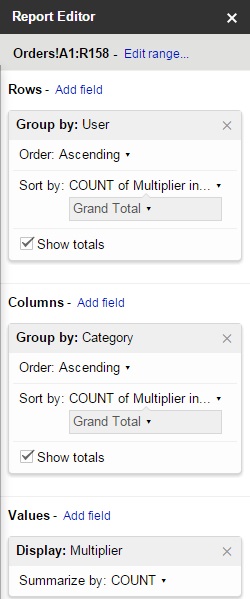
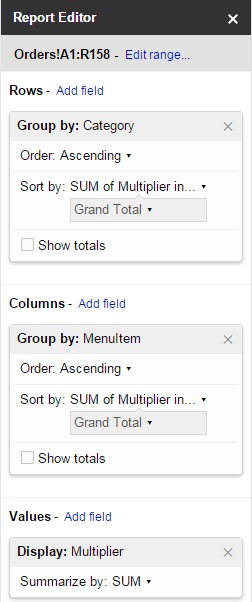
| Report Editor Settings |
| Category count / Server |
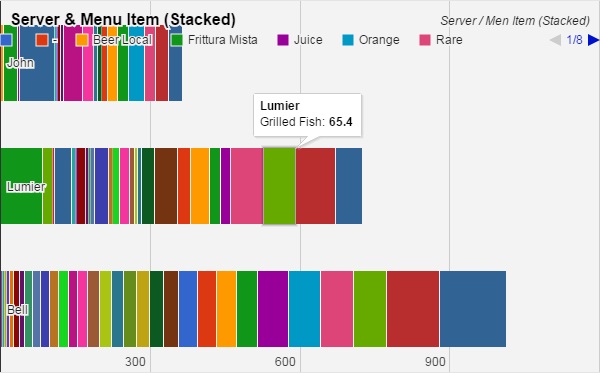 |
| How to generate |
| Server & Menu Items (Stacked) |
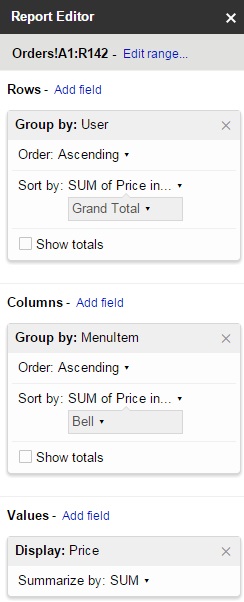
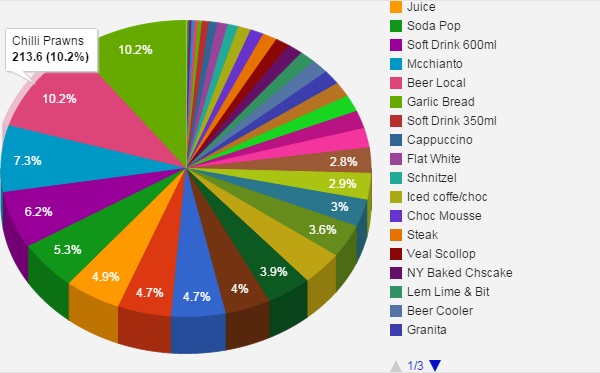 |
| Report Editor Settings |
| Menu Item Sales - Pie Chart |
 |
| How to generate |
| Category / Menu Items (Stacked) |
Once you have the reports you require for you business, simply copy and apply them to the date range of any historical data.
Using modern cloud based reporting tools such as the report editor, any type of report can be generated, simple or complex it's up to you.
All reports can be:
All reports can be:
- Printed.
- Published as a web link.
- Embedded in a web page.
- Saved or downloaded as PDF, Excel, csv, zip and other formats.
- Emailed or shared with collaborators.